Before You Begin
User Permissions Required: Administrator or View Users
Recommended Uses
- Monitor alarm response performance.
- Review alarm activity by group.
- Identify departments that may benefit from additional training.
- Evaluate alarm acknowledgment and resolution times.
- Support quality improvement initiatives.
Do Not Use For
- Viewing live alarm activity.
- Editing alarm settings.
- Investigating individual alarm events.
Understanding the Alarm Resolution Report
The Alarm Resolution Report provides a summary of how alarms are managed across your SoniCloud system during a selected date range.
Rather than focusing on individual alarm events, this report measures how quickly alarms are acknowledged, resolved, or remain active. Results are organized by Group, allowing you to compare performance across different facilities, departments, or operational areas.
The report is especially useful for identifying response trends, measuring operational performance, and determining where additional user training may improve alarm management.
What's Included
Alarm Activity by Group
The report organizes alarm statistics by Group.
Groups often represent:
- Physical locations
- Buildings
- Departments
- Business units
Each row summarizes alarm activity for a specific group during the selected reporting period.
Total Alarms
Displays the total number of alarms generated during the selected date range.
If your organization uses a Default Group, this row typically represents all alarms across the entire site because the Default Group has visibility into every monitoring location.
Comparing the Default Group with individual groups helps determine where alarm activity is occurring throughout your organization.
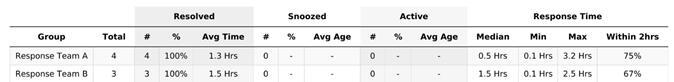
Resolved Alarms
Displays alarms that were successfully resolved during the reporting period.
The report includes:
- Total number of resolved alarms
- Percentage of total alarms resolved
- Average time required to resolve those alarms
This information helps measure how efficiently alarms are being addressed.
Snoozed Alarms
Displays alarms that were placed into Snoozed status.
The report includes:
- Total number of snoozed alarms
- Percentage of total alarms snoozed
- Average amount of time alarms remained snoozed
Monitoring snoozed alarms helps ensure alarms are temporarily managed without remaining unresolved longer than expected.
Active Alarms
Displays alarms that were still active when the report was generated.
The report includes:
- Total number of active alarms
- Percentage of total alarms still active
- Average amount of time alarms have remained active
A large number of active alarms may indicate delayed response times or unresolved environmental conditions.
Time to First Response
Displays the average amount of time between an alarm being generated and the first action taken.
Examples of a first response include:
- Acknowledging the alarm
- Silencing the alarm
- Adding a note
- Performing another documented alarm action
This metric helps evaluate how quickly users begin responding after an alarm occurs, even if final resolution happens later.
Let's Get Started
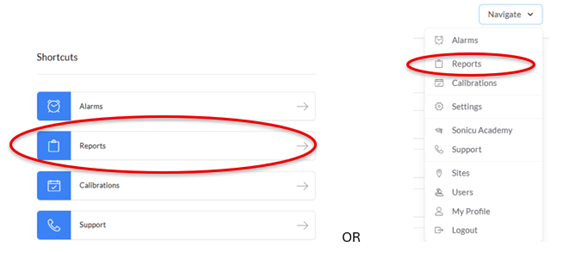
Step 1 – Open the Reports Page
Navigate to the Reports page.
What you'll see
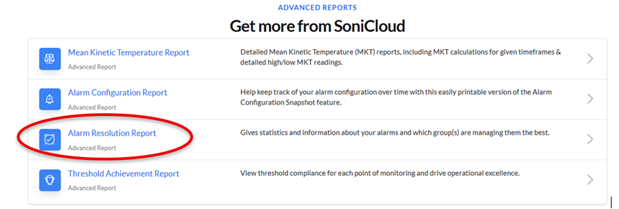
Step 2 – Select Alarm Resolution Report
Select Alarm Resolution Report.
What you'll see
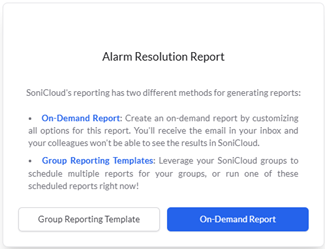
Step 3 – Select a Report Type
Choose one of the following:
Group Reporting Template
- Schedule recurring reports
- Run previously scheduled reports
- Generate reports for multiple groups
On-Demand Report
- Customize report options
- Generate a report immediately
- Receive the completed report by email
What you'll see
Group Reporting Template
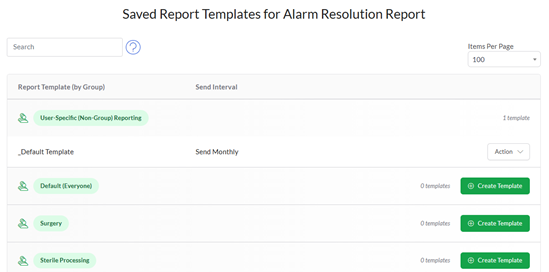
On-Demand Report
Step 4 – Select a Date Range
Choose the reporting period you would like to review.
What you'll see
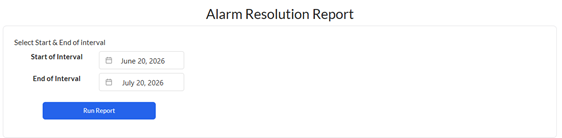
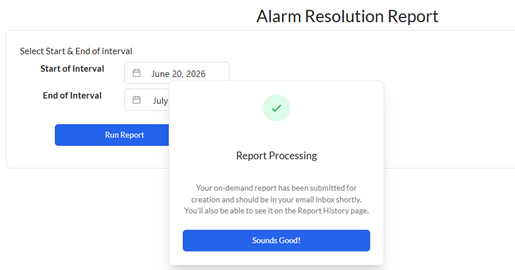
Step 5 – Run the Report
Select Run Report.
What you'll see
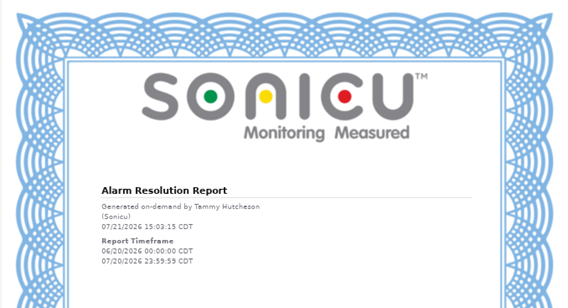
Verify the Results
The report has been generated successfully when:
- The selected reporting period is displayed.
- Alarm statistics are organized by group.
- Resolution, Snoozed, Active, and Time to First Response metrics are displayed.
- The information reflects the selected date range.
Understanding the Report Results
When reviewing the report, consider the following questions:
- Which groups generated the most alarms?
- Are alarms being resolved promptly?
- Are a large number of alarms remaining active?
- Are alarms spending excessive time in Snoozed status?
- Which groups have the longest response times?
- Does the Time to First Response indicate users are responding quickly after alarms occur?
These metrics can help identify operational trends, improve alarm response procedures, and determine where additional user training may be beneficial.
Need Additional Help?
If you have questions about the Alarm Resolution Report or need assistance interpreting the report results, the Sonicu Support team is here to help.
Email: support@sonicu.com
Phone: (317) 468-2345
Support Hours: Monday–Friday, 8:00 AM – 5:00 PM EST