
This report shows statistics and information regarding Alarm Response Time and Resolution of Alarms. This report is separated by Groups (A group can be a separate physical location or different departments) and can be used to pinpoint where additional training on the Sonicu system may be needed.
To access your reports, you can go to the reports page from Either your Dashboard page, The Navigate menu, or your Settings page.
From the reports page select Alarm Resolution report.
The only settings that can be selected for this report is the date range.

Once you have selected the date range you wish to run for your report, click "Run Report." Your report will load on the SoniCloud Site.

When the report loads, you will see all Groups listed in the left column.
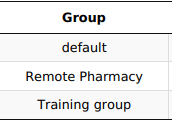
Whichever group has been assigned as the default Group on your site, should reflect the total of all Alarms across your site within the specified date range.
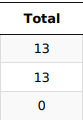
The second column will show the total amount of alarms and which groups have access to them. In the example below, the Default group is showing 13 alarms. The Remote Pharmacy Group is also showing 13 alarms, while the Training Group is showing 0 alarms. This means that all alarms that happened within the date range specified for the report happened in Zones the Remote Pharmacy Group is responsible for. The Default Group also sees these, as they are able to see the entire site. The Training Group has not received any alarms for this date range.
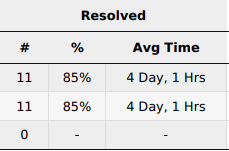
Columns 3, 4, and 5 show the Alarms that have been Resolved during the date range. Column 3 shows the number of alarms from that have been moved to this alarm status. In the example below, we see 11 alarms have been Resolved. Column 4 shows the percent of the total number of alarms that Column 3 represents, in this case 85%. Column 5 indicates how long it took for these alarms to be marked as Resolved.
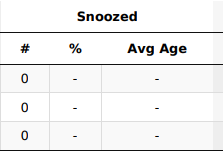
Columns 6, 7, and 8 show the Alarms that are currently marked as Snoozed at the time the report is ran. Column 6 shows the number of alarms that are currently in this alarm status. In the example below, we see 0 alarms are Snoozed. Column 7 shows the percent of the total number of alarms that Column 6 represents, in this case 0%. Column 8 indicates how long the alarms have been marked as Snoozed.
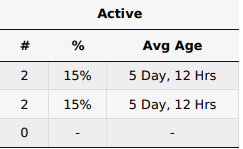
Columns 9, 10, and 11 show the Alarms that are currently marked as Active at the time the report is ran. Column 8 shows the number of alarms that are currently in this alarm status. In the example below, we see 2 alarms are Active. Column 10 shows the percent of the total number of alarms that Column 9 represents, in this case 15%. Column 8 indicates how long the alarms have been marked as Active.
For any more questions regarding the Alarm Resolution Report please contact Sonicu Support for assistance. Sonicu Support can be reached by email at support@sonicu.com or by calling (317) 620-8627. Sonicu Support is available M-F 8 AM- 5 PM EST.