
The S.T.A.R. report provides information on how Sound Pressure is affecting the area being monitored. The S.T.A.R. reports gathers information into 2 measurements. Leq and Lmax. These 2 measurements are reported in 5-minute blocks.
Leq is the average sound pressure level. Please note that this is not a mathematical average of your sound. Instead, this is an aggregate average of how the sound would be perceived by the human ear.
Lmax is the single loudest sound event per 5-minute period. For example, a single hand clap in a completely silent room could be the loudest event in that period of time.
To run the S.T.A.R. report, please follow the steps below:
To access your reports, you can go to the reports page from either your Dashboard page, the Navigate menu, or your Settings page.
From the reports page select Sound Target Achievement Report (S.T.A.R.)
This report measures sound pressure within a specific date range. This date range can either be Daily or Weekly. The date range format is set on the Report Settings page. Details to enable or edit the report settings can be found here. How to enable the S.T.A.R. Report
To run the report, select the end date for the time period you wish to see reporting and choose Get Report.

The S.T.A.R. Report is broken down into 2 sections. The first section is Top 10 Sound Events. This section of the report breaks down your 1o loudest average periods of time for the time period requested on the report. There are 2 columns for this section of the report. The first column is the Leq, or the loudest 5-minute blocks from a single point in a day or week, depending on the settings for the report. The second column is the Lmax, which displays the single loudest sound event, as well as the corresponding 5-minute block of time in which that sound event happened.
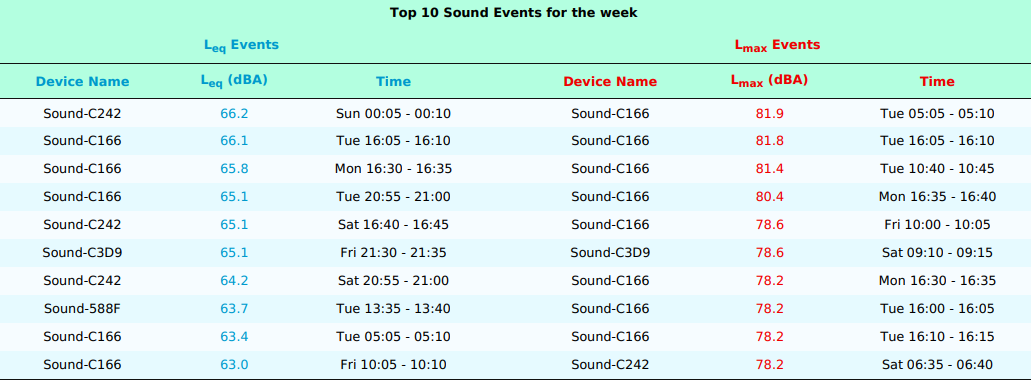
The Leq section will take the 10 loudest average 5-minute periods and display them as listed below. This will also show the period of time that block of time happened.
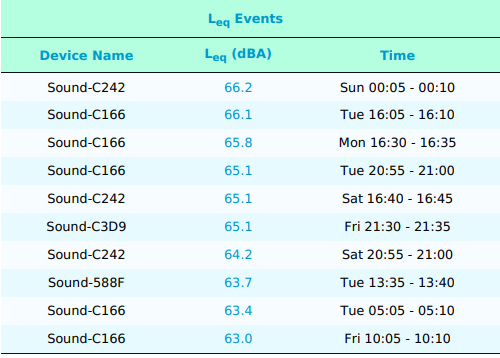
In the example above, the loudest 5-minuted period of time in this area being monitored was recorded by meter "Sound-C242", and took place on Sunday between 12:05-12:10 AM. The average sound pressure during this time was recorded at 66.2 dBA.
The Lmax section will take the 10 loudest single sound events and the time period that event happened and display them as listed below.

In the example above, the single loudest sound event in the area being monitored was recorded by meter "Sound-C166", and took place on Tuesday between 5:05-5:10 AM. The loudest sound event recorded was 81.9 dBA.
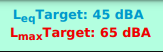
The second section of the S.T.A.R. report indicates the percentage of time sound pressure was maintained below the target Leq and Lmax.

In this chart, both the Leq and Lmax averages are given to show sound compliance. The Leq and Lmax targets are shown in the upper left corner of the chart. For this example, we have shown targets of 45 dBA for the Leq and 65 dBA for the Lmax. These are the recommended sound levels for a NICU as recommended by the EPA and the American Academy of Pediatrics. Each target number will be displayed on the chart in the corresponding color for the Key below. Leq columns are in Blue, Lmax columns are in Red.
Please see the following example of how these measurments appear on the report.

In this example, Sound meter 1 was below the Leq target of 45 dBA 0% of the time. However, it was under the Lmax target of 65 dBA 99% of the time. Meanwhile, Sound meter 3 never had a 5-minute block of time that was within the Leq, but also never had a single sound event go over 65 dBA, as shown by the Lmax measurement of 100%.
The bottom line on the report will show the averages for the entire area or zone being monitored.

In the example above on the last day of the week being monitored, only 6% of the 5-minute blocks of time being monitored by every meter were within the Leq target of 45 dBA. While 94% of the readings taken were within the 65 dBA Lmax.
The zone or area averages are also the values that would be graphed on the S.T.A.R. Addendum report, should you wish to run that as well.
For additional questions regarding the S.T.A.R. Report please contact Sonicu Support for assistance. Sonicu Support can be reached by email at support@sonicu.com or by calling 317-468-2345. Sonicu Support is available M-F 8 AM- 5 PM EST.